Cambium Networks XMS-Cloud Part Three
Cambium Networks XMS-Cloud: Monitoring and Troubleshooting
INTRODUCTION
Welcome to our final blog post covering Cambium Networks XMS Cloud. By now you should have already read our first blog introducing
XMS Cloud (click here to read), and our second blog post which runs you through configuring and managing access points (APs) by creating network profiles (click here to read).
In this post, we will be looking at the dashboard, and how to troubleshoot a client and how to set up reports.
Let’s start by creating a dashboard by following the steps detailed below:
CREATE A DASHBOARD
XMS-Cloud dashboard has a set of customisable widgets reporting on different aspects and elements of your network. Multiple dashboards can be created, the look and feel of each dashboard can be customised individually as per your requirements. Widgets show information about Access Points, Clients and Applications which can be very useful when managing your network.
Step One
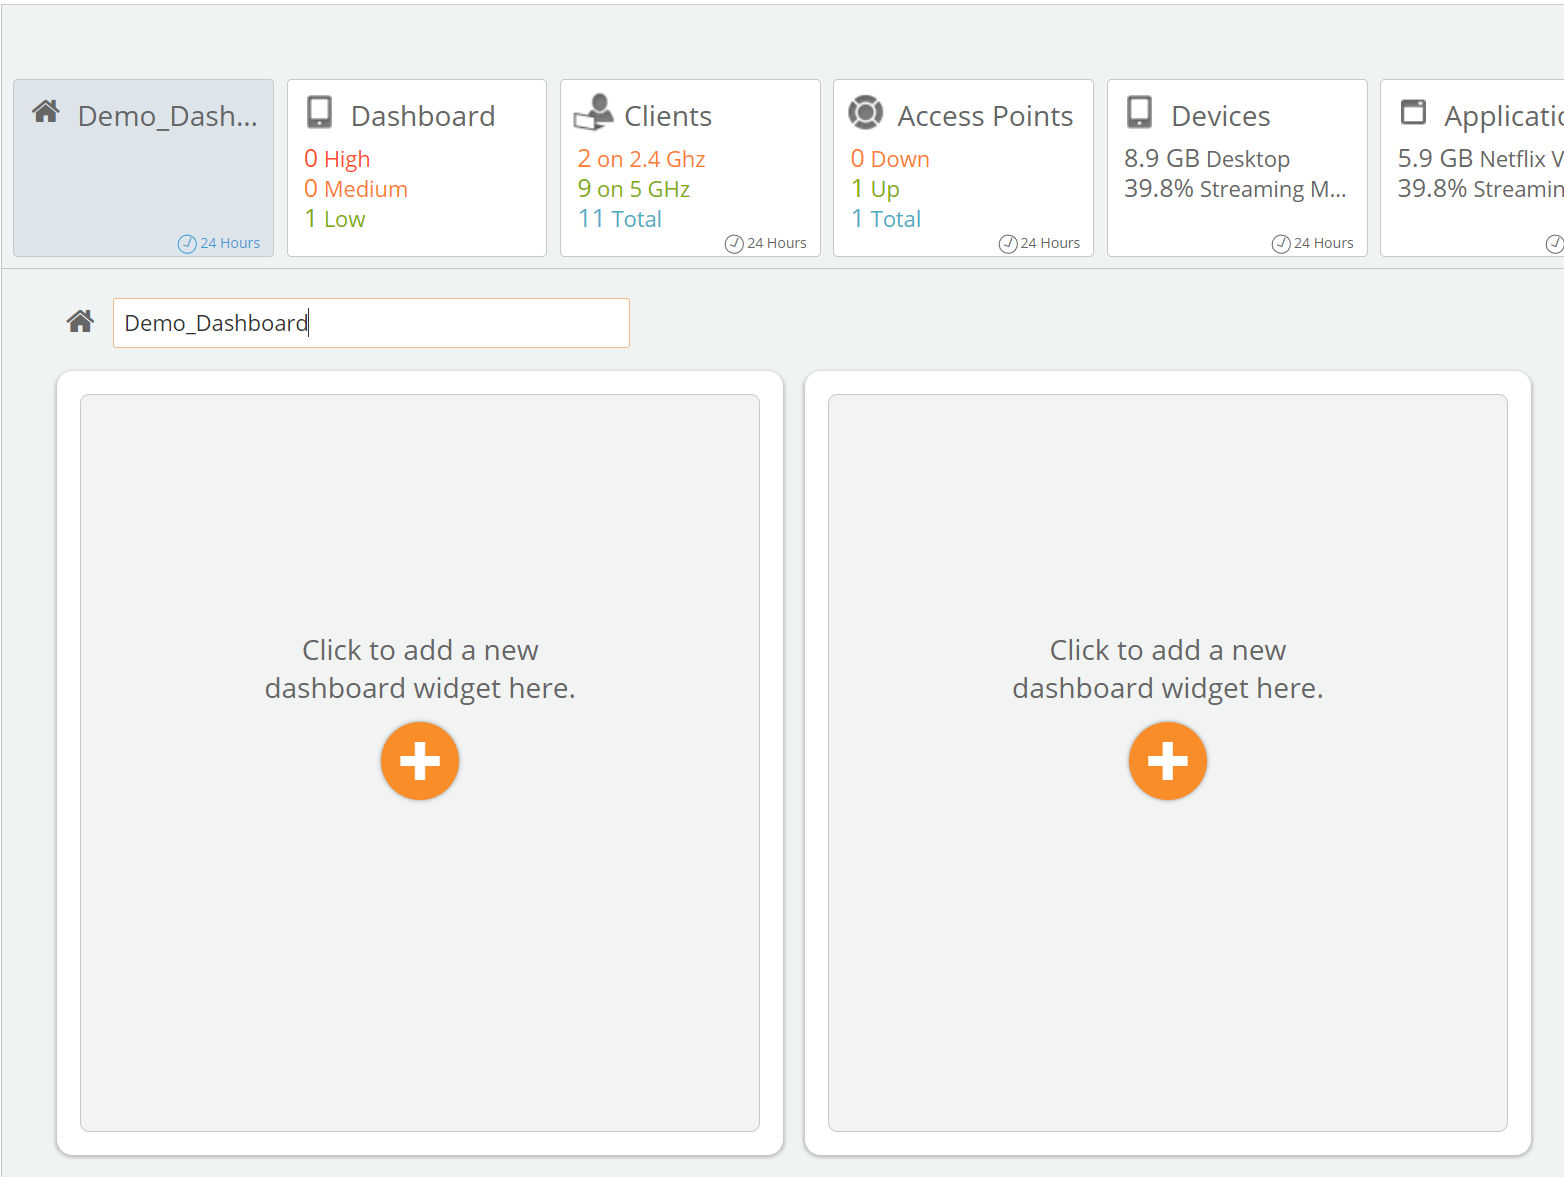
Create a dashboard. Click the “new” button, and give your dashboard a name.

Add widgets to the dashboard. Click the orange plus sign. You can now select which widgets to add.
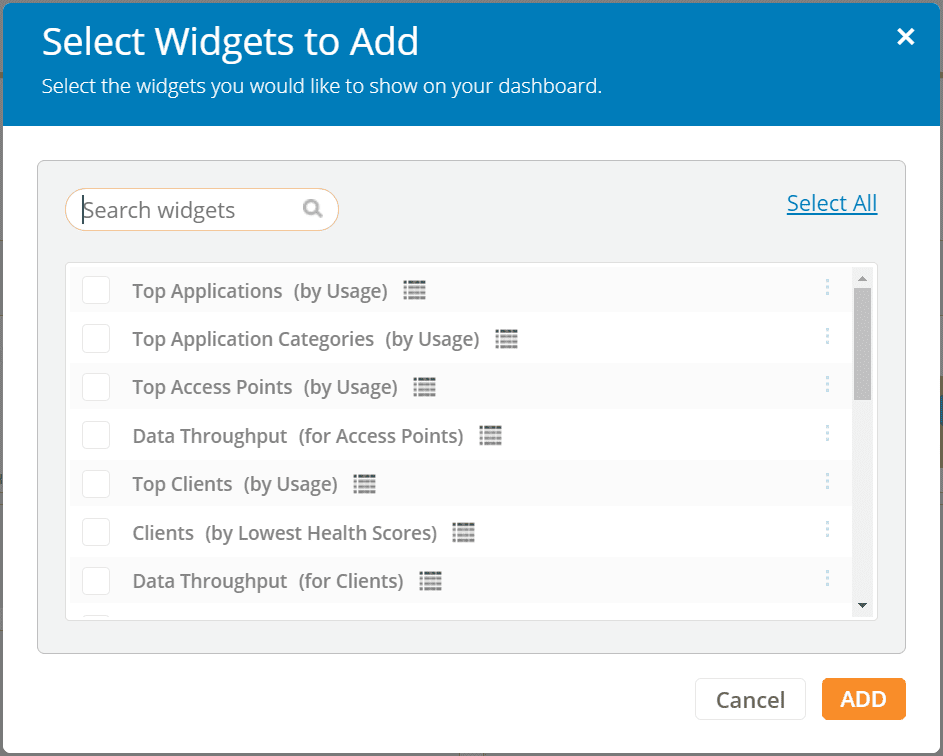
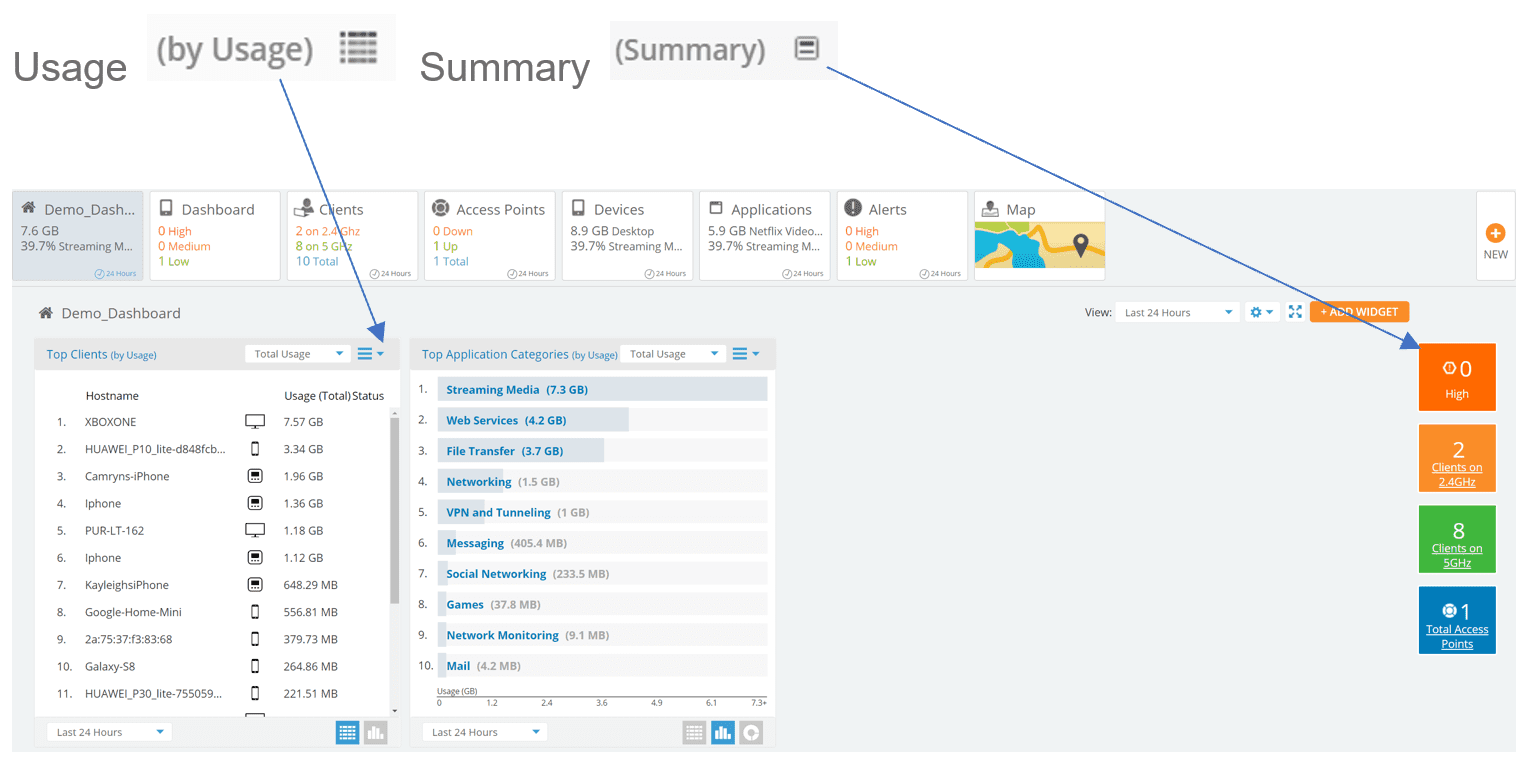
There are two types of widgets, usage and summary.
Step Two
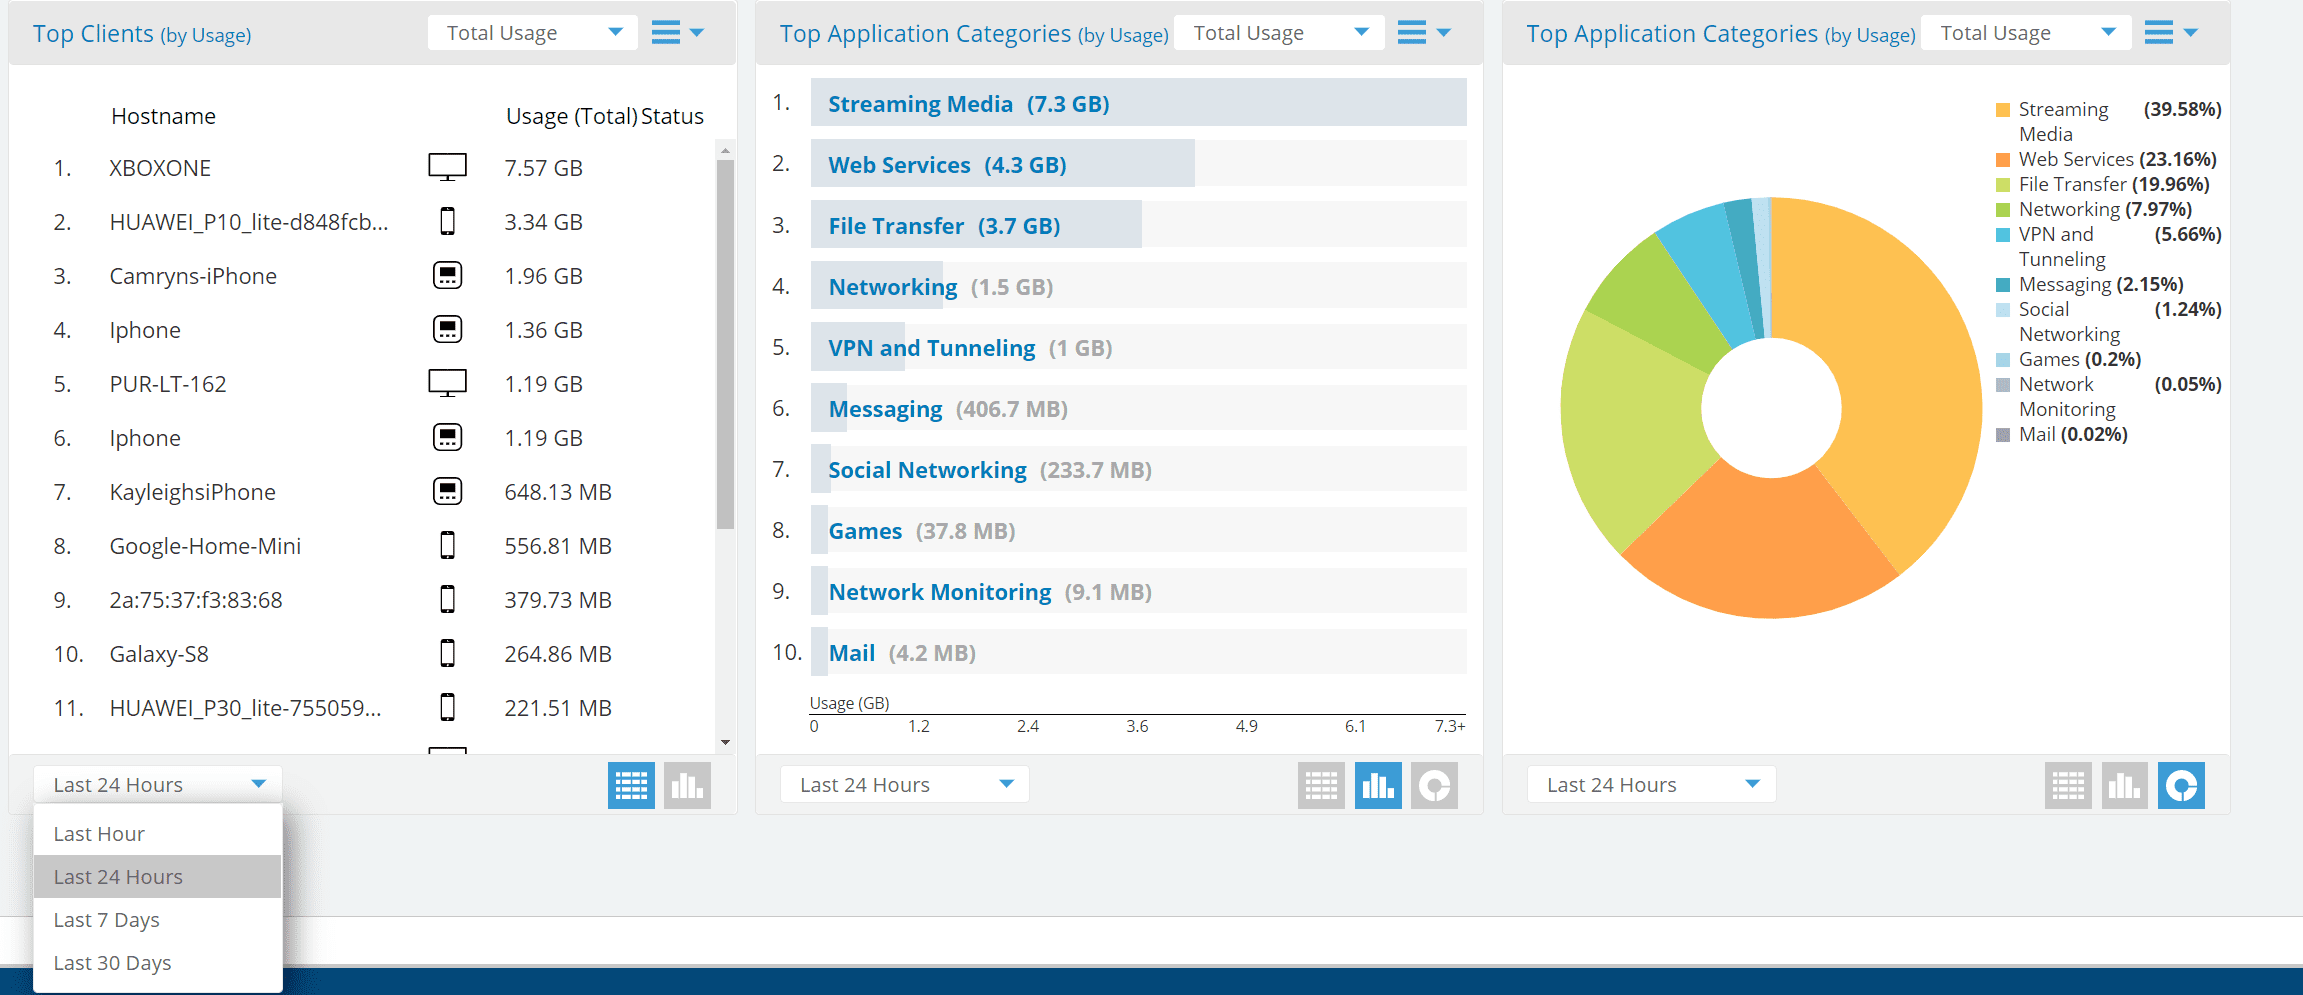
Customise the widgets. Change the look and feel of the widgets, drag and drop into any order that you prefer. Select the look of the widgets into grid, bar or pie and change the reporting interval to either 1hr, 24hr, 7 days or 30 days.
TROUBLESHOOTING A CLIENT
Step One
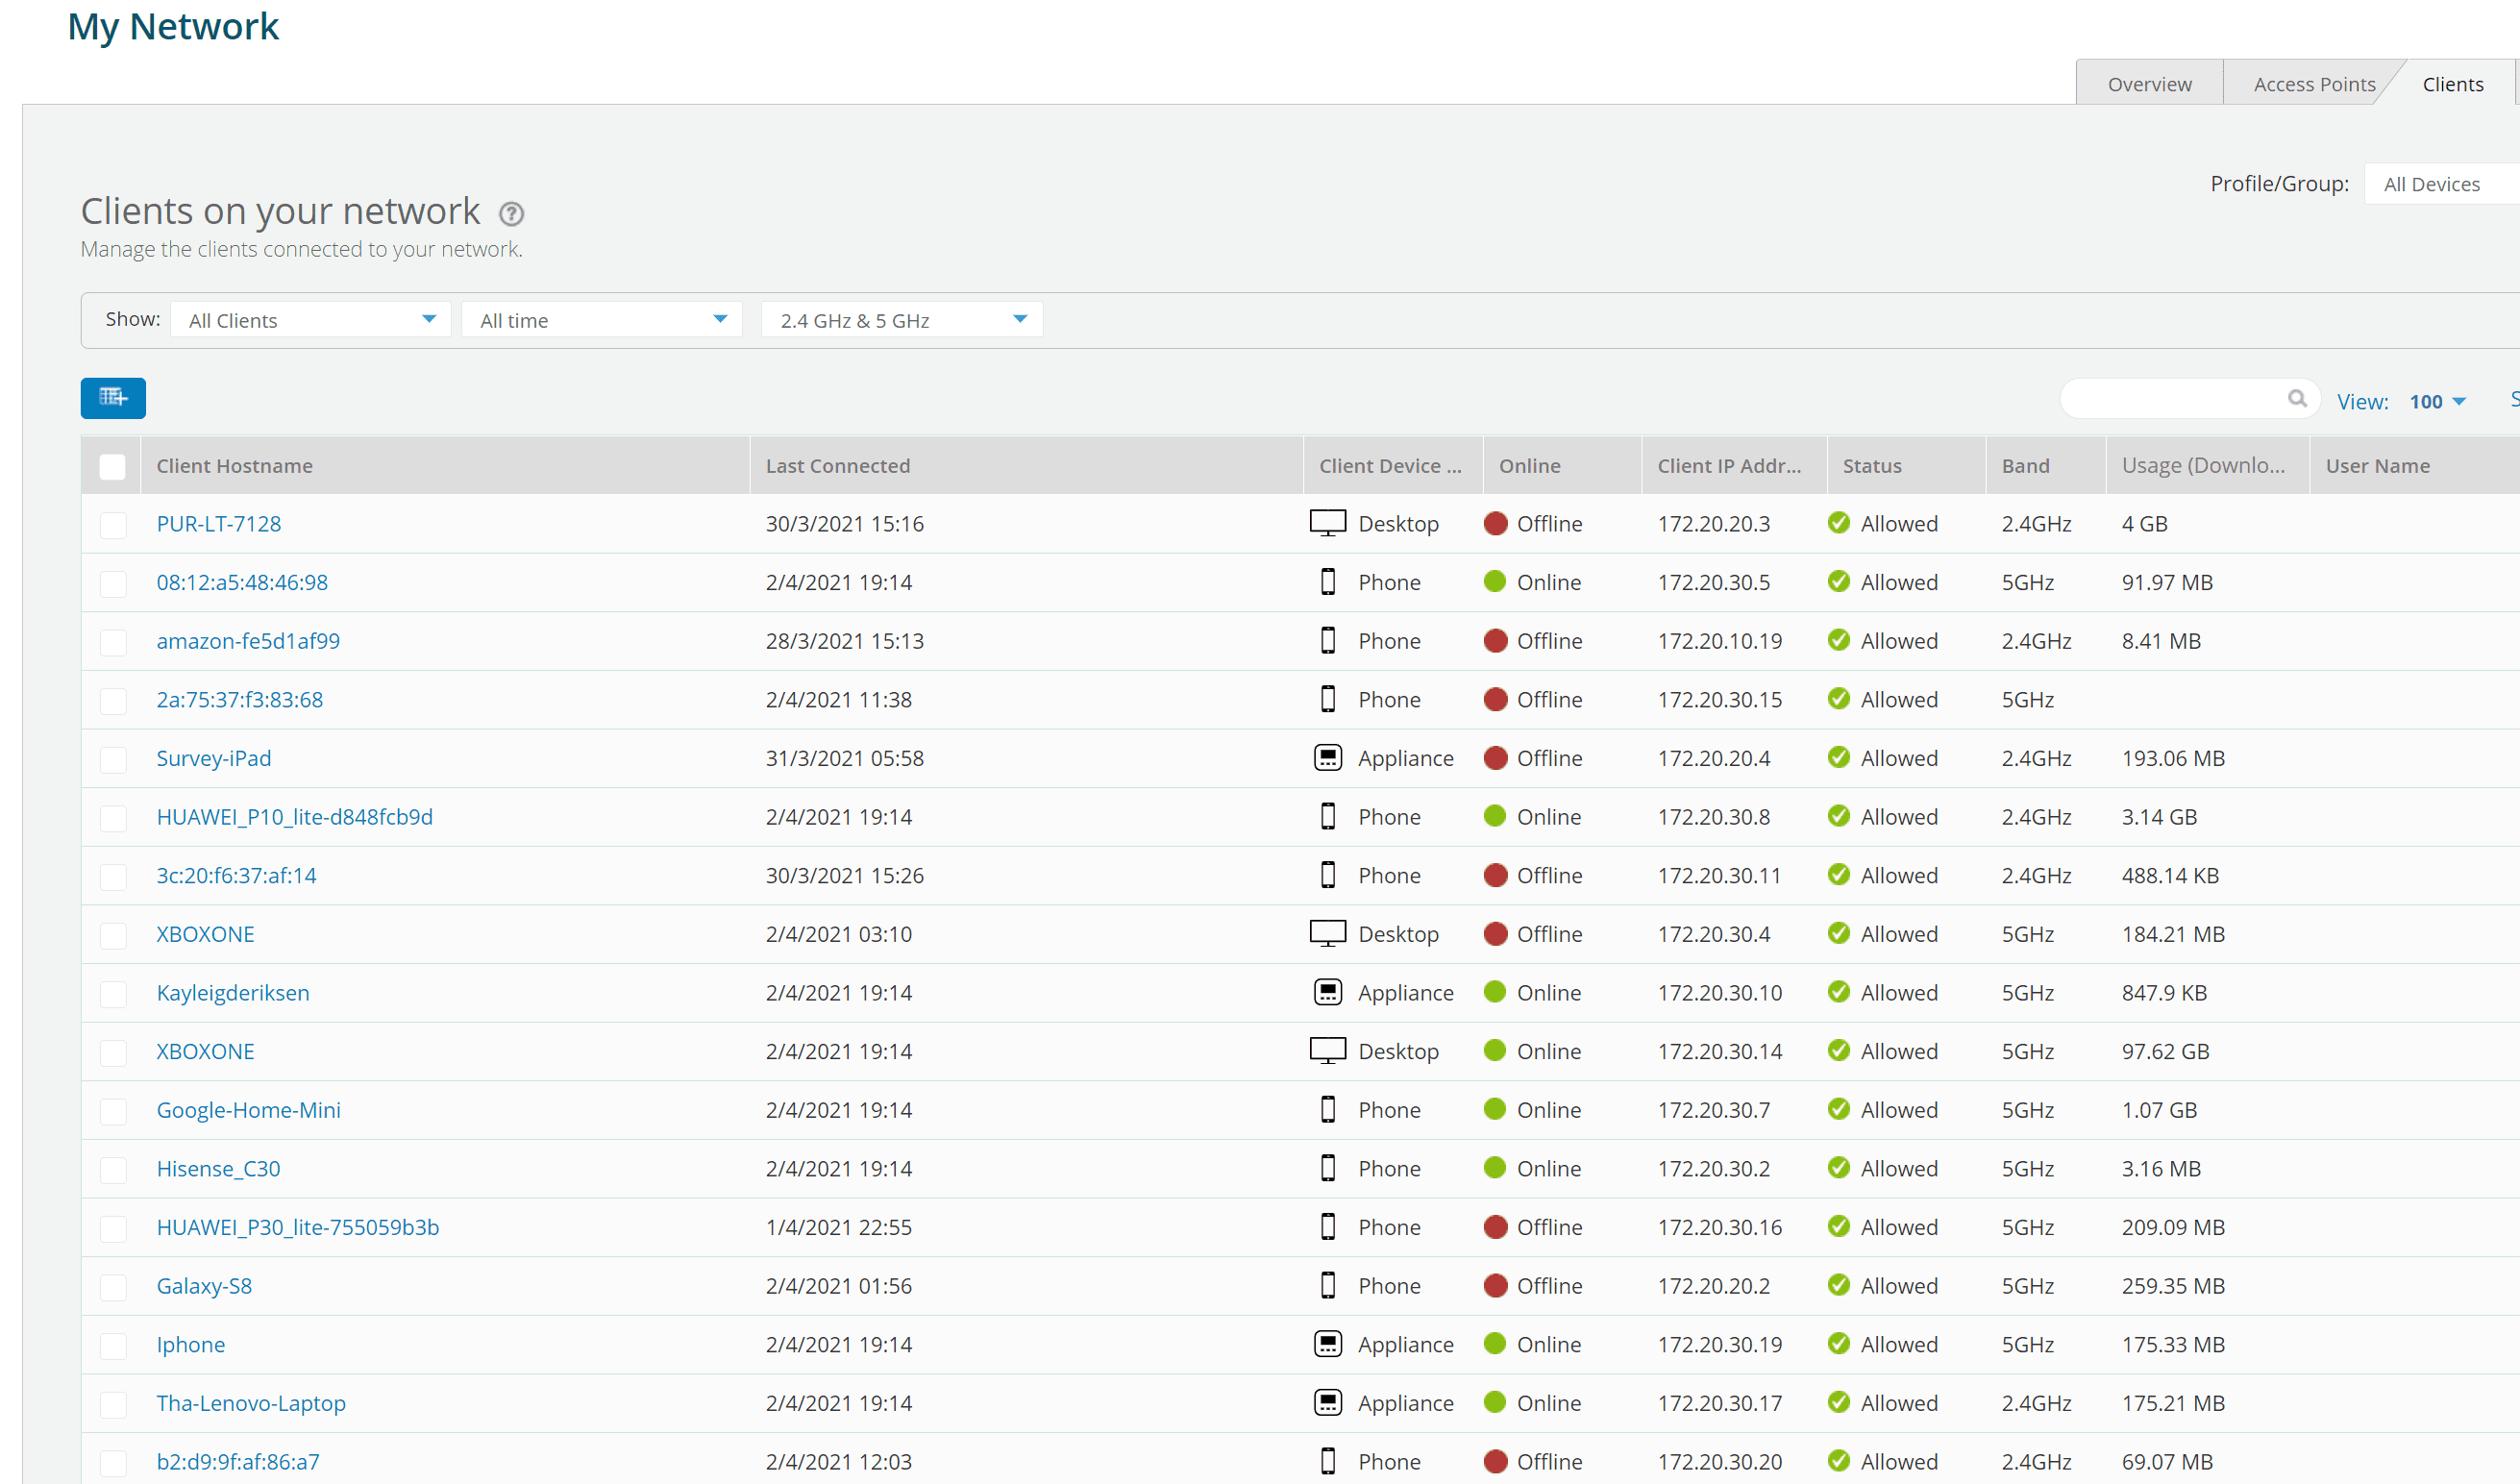
Clients tab. Click the client’s tab to list all clients in the network, and search or select the client device.
Step Two
Search and or select the client
Hover your mouse over the device and select “View Client Details”.

Step Three
Viewing the Client
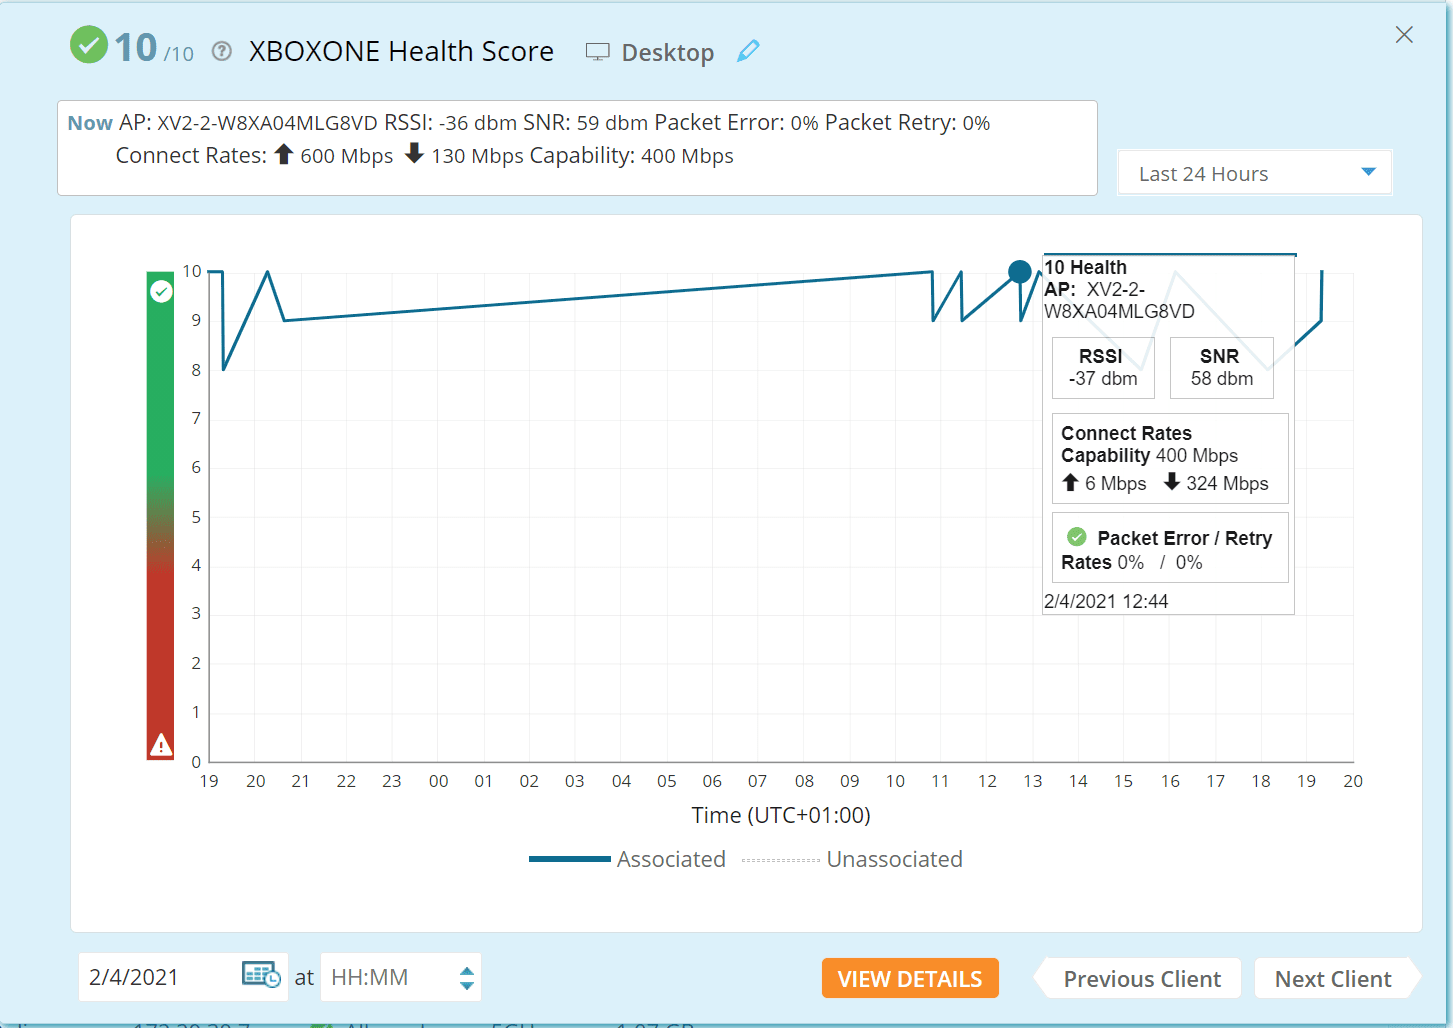
A flyout window will pop out and show the health score. Health Score is the accumulation of several performance metrics such as RSSI, SNR, packet error rates, retry rates and connection rates. Hovering over any point of the graph will display the health score at that point in time.
Step Four
View Details
Select the ‘View Details’ button for more precise information about the client, for example, Top Applications usage for the client.

Step Five
Blocking a Device
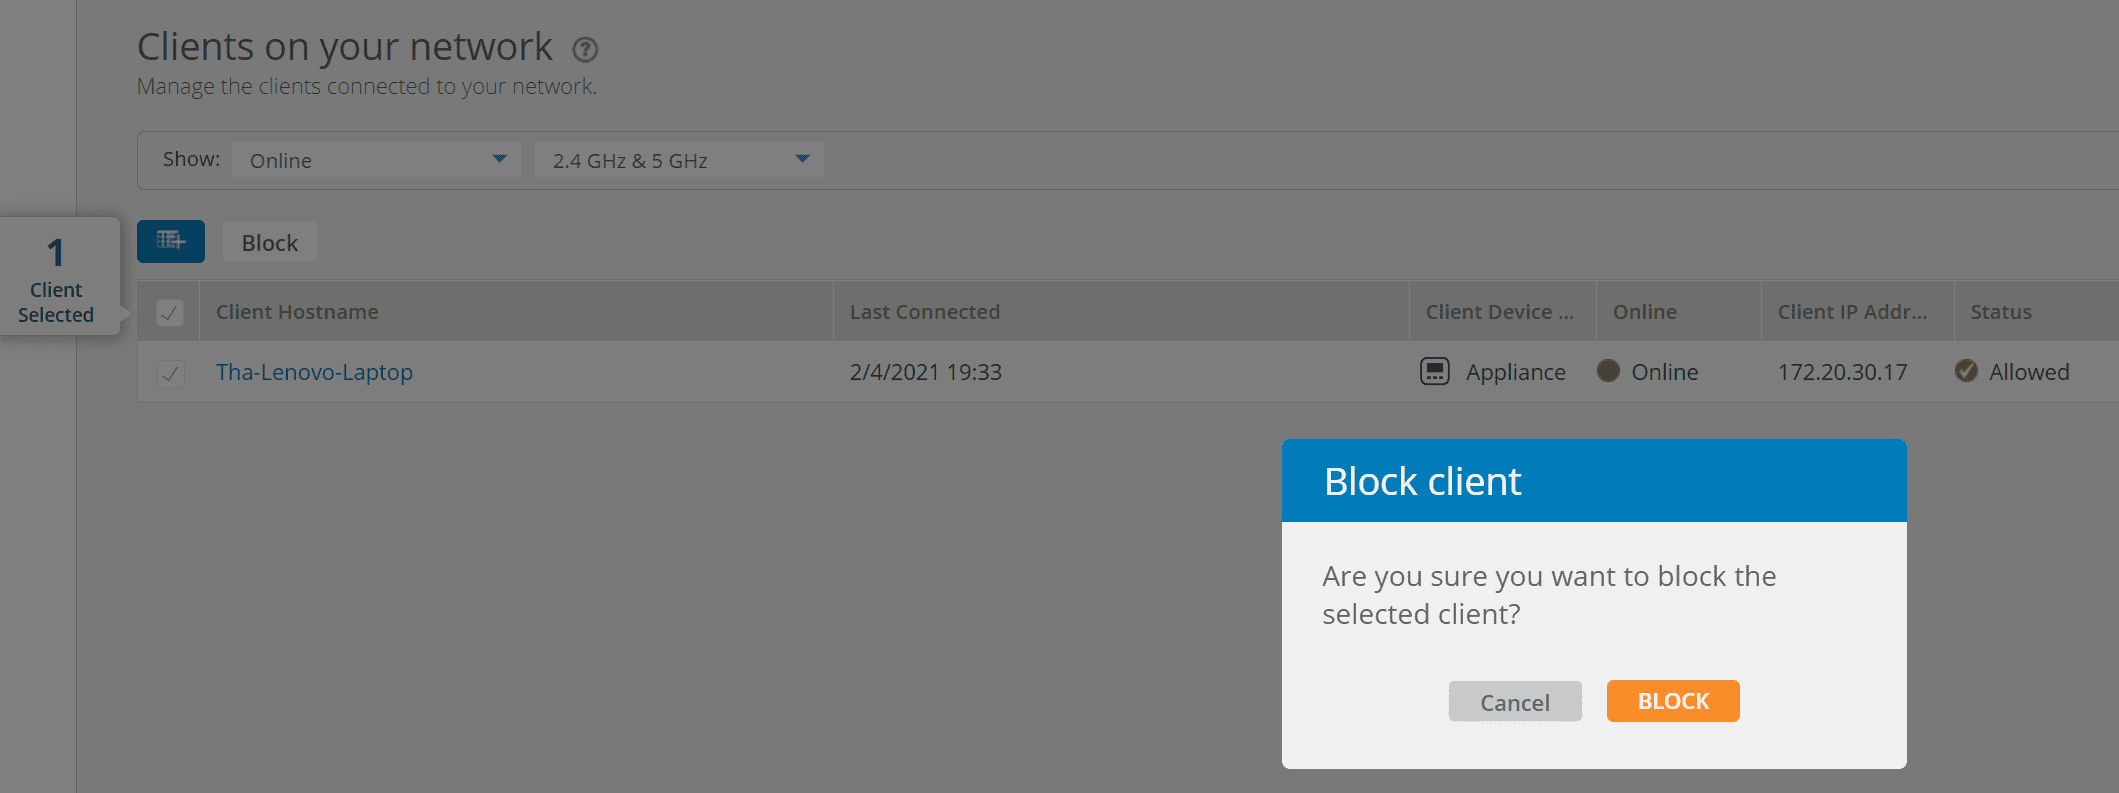
Blocking an abusive client is simple and easy. Select the client and click on the ‘Block’ button.
CREATING REPORTS
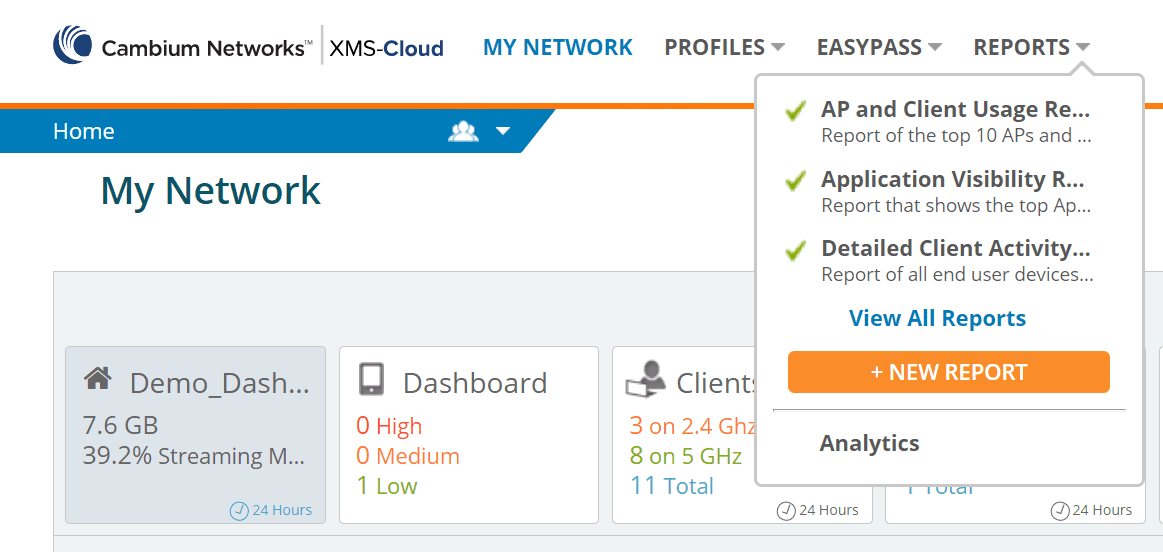
Easily create reports using the templates included in XMS-Cloud or design your own report templates and customise them as per your requirement.
Step One
Select Reports
Step Two
Customise View
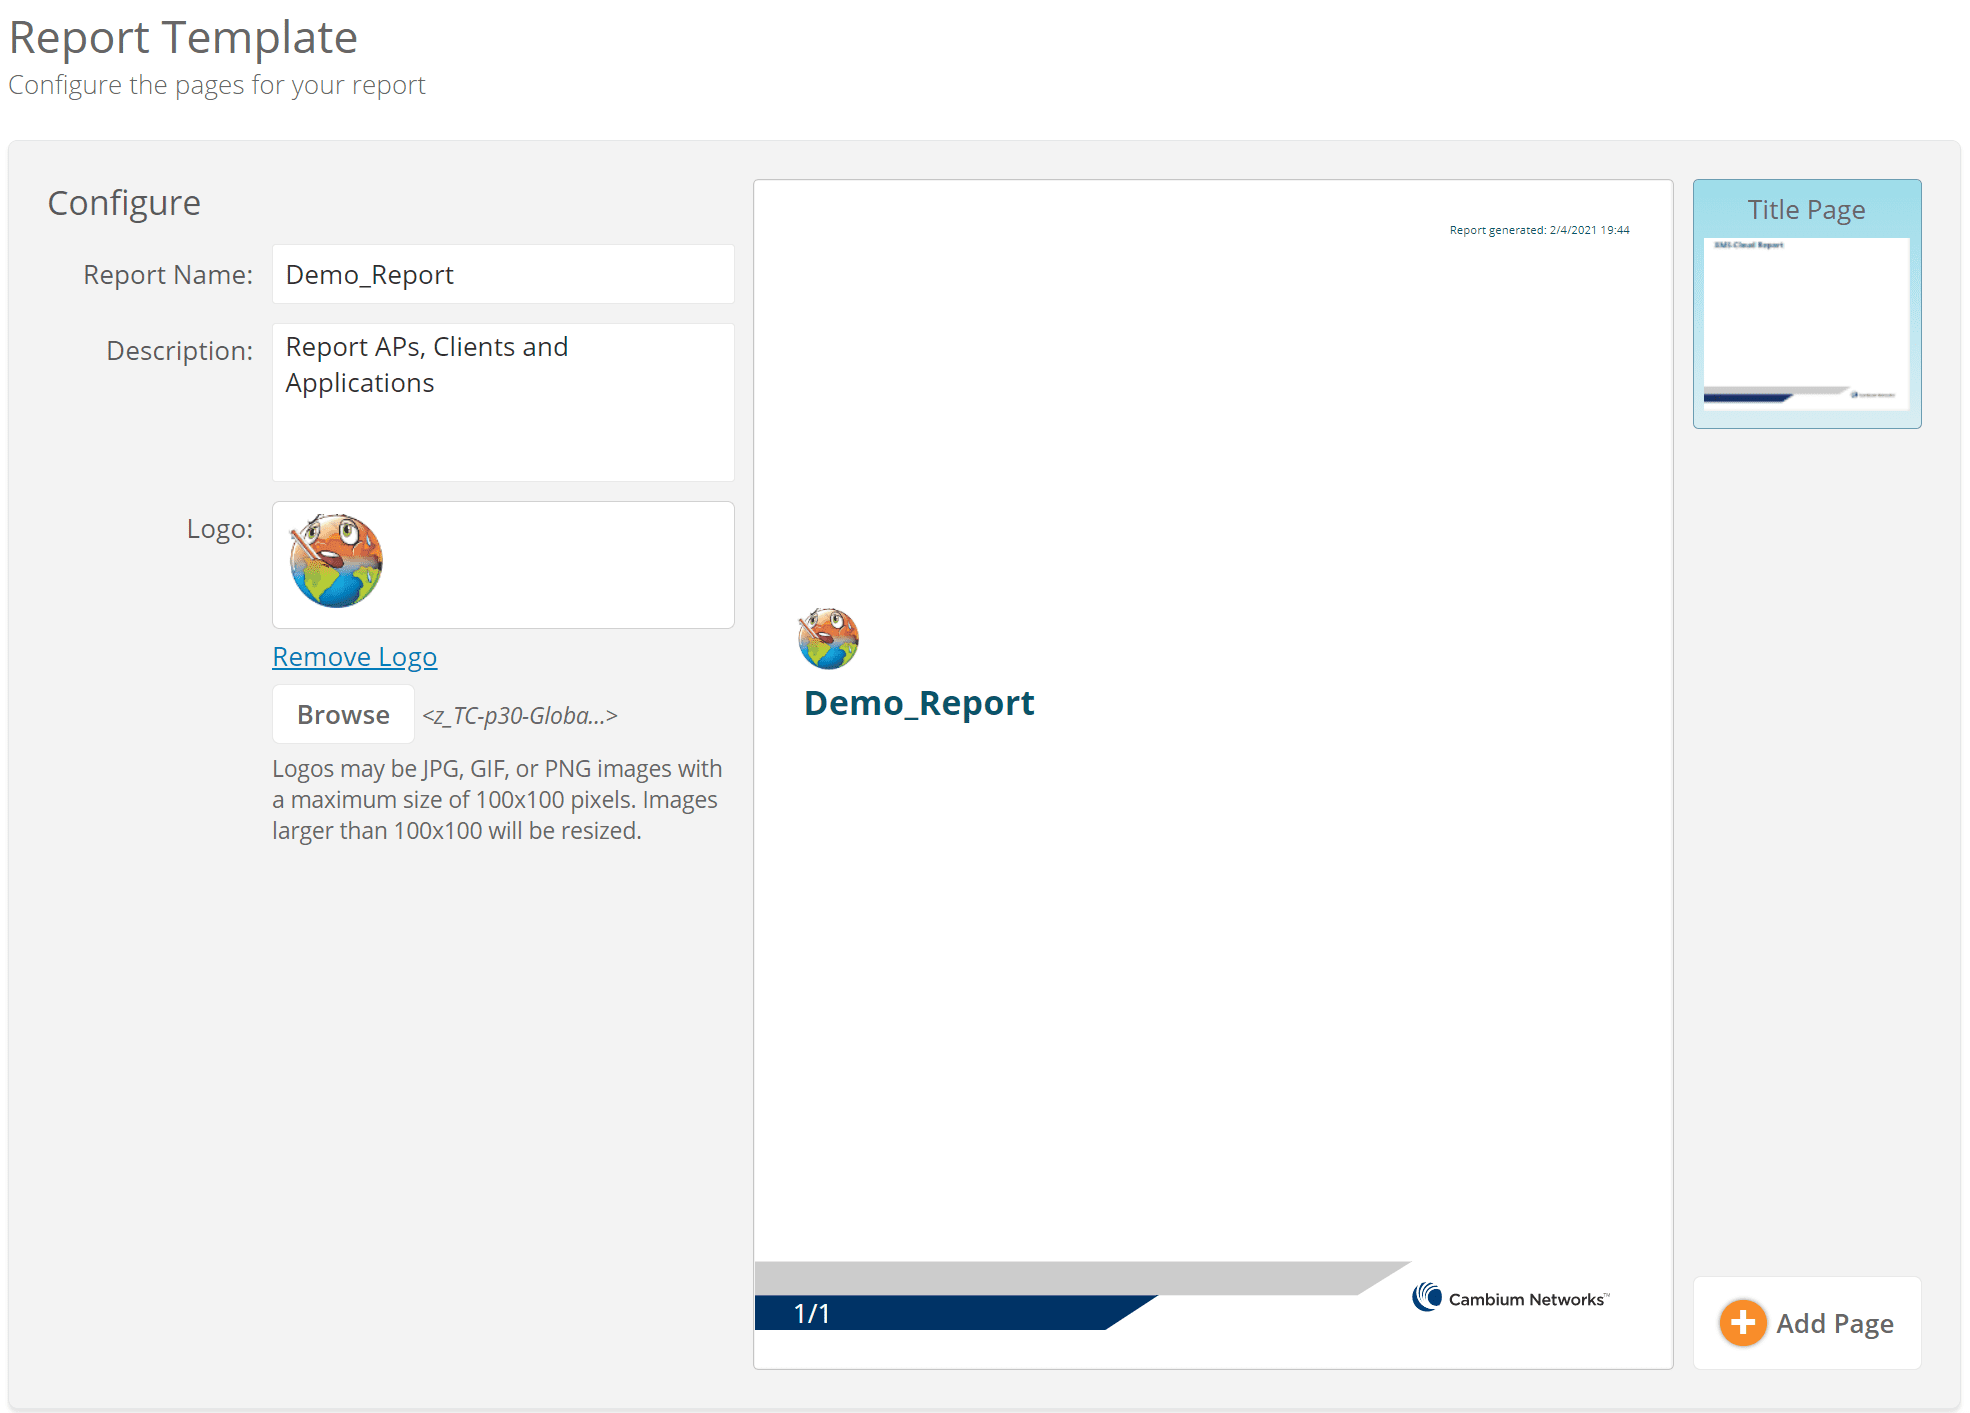
Step Three
Adding Pages
Use multiple pages to display information on the various aspects of the network.
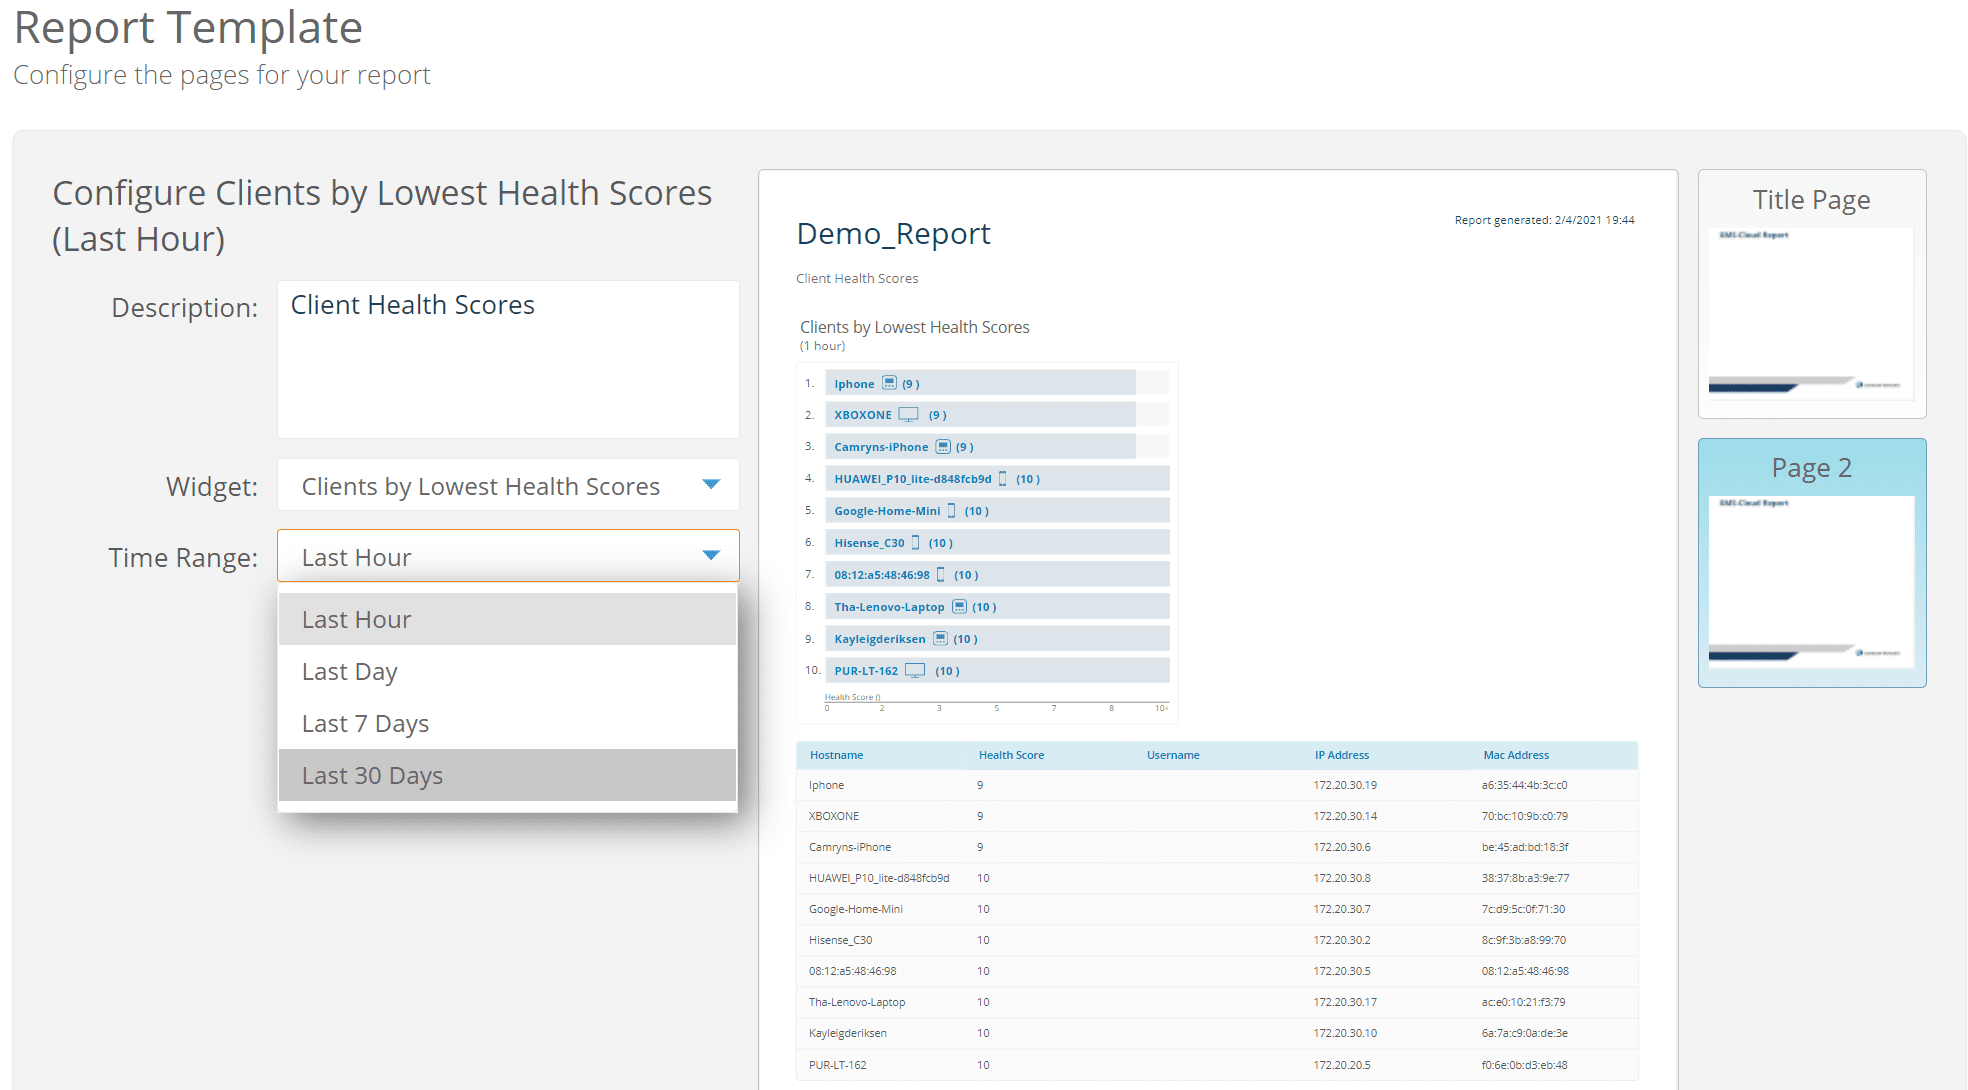
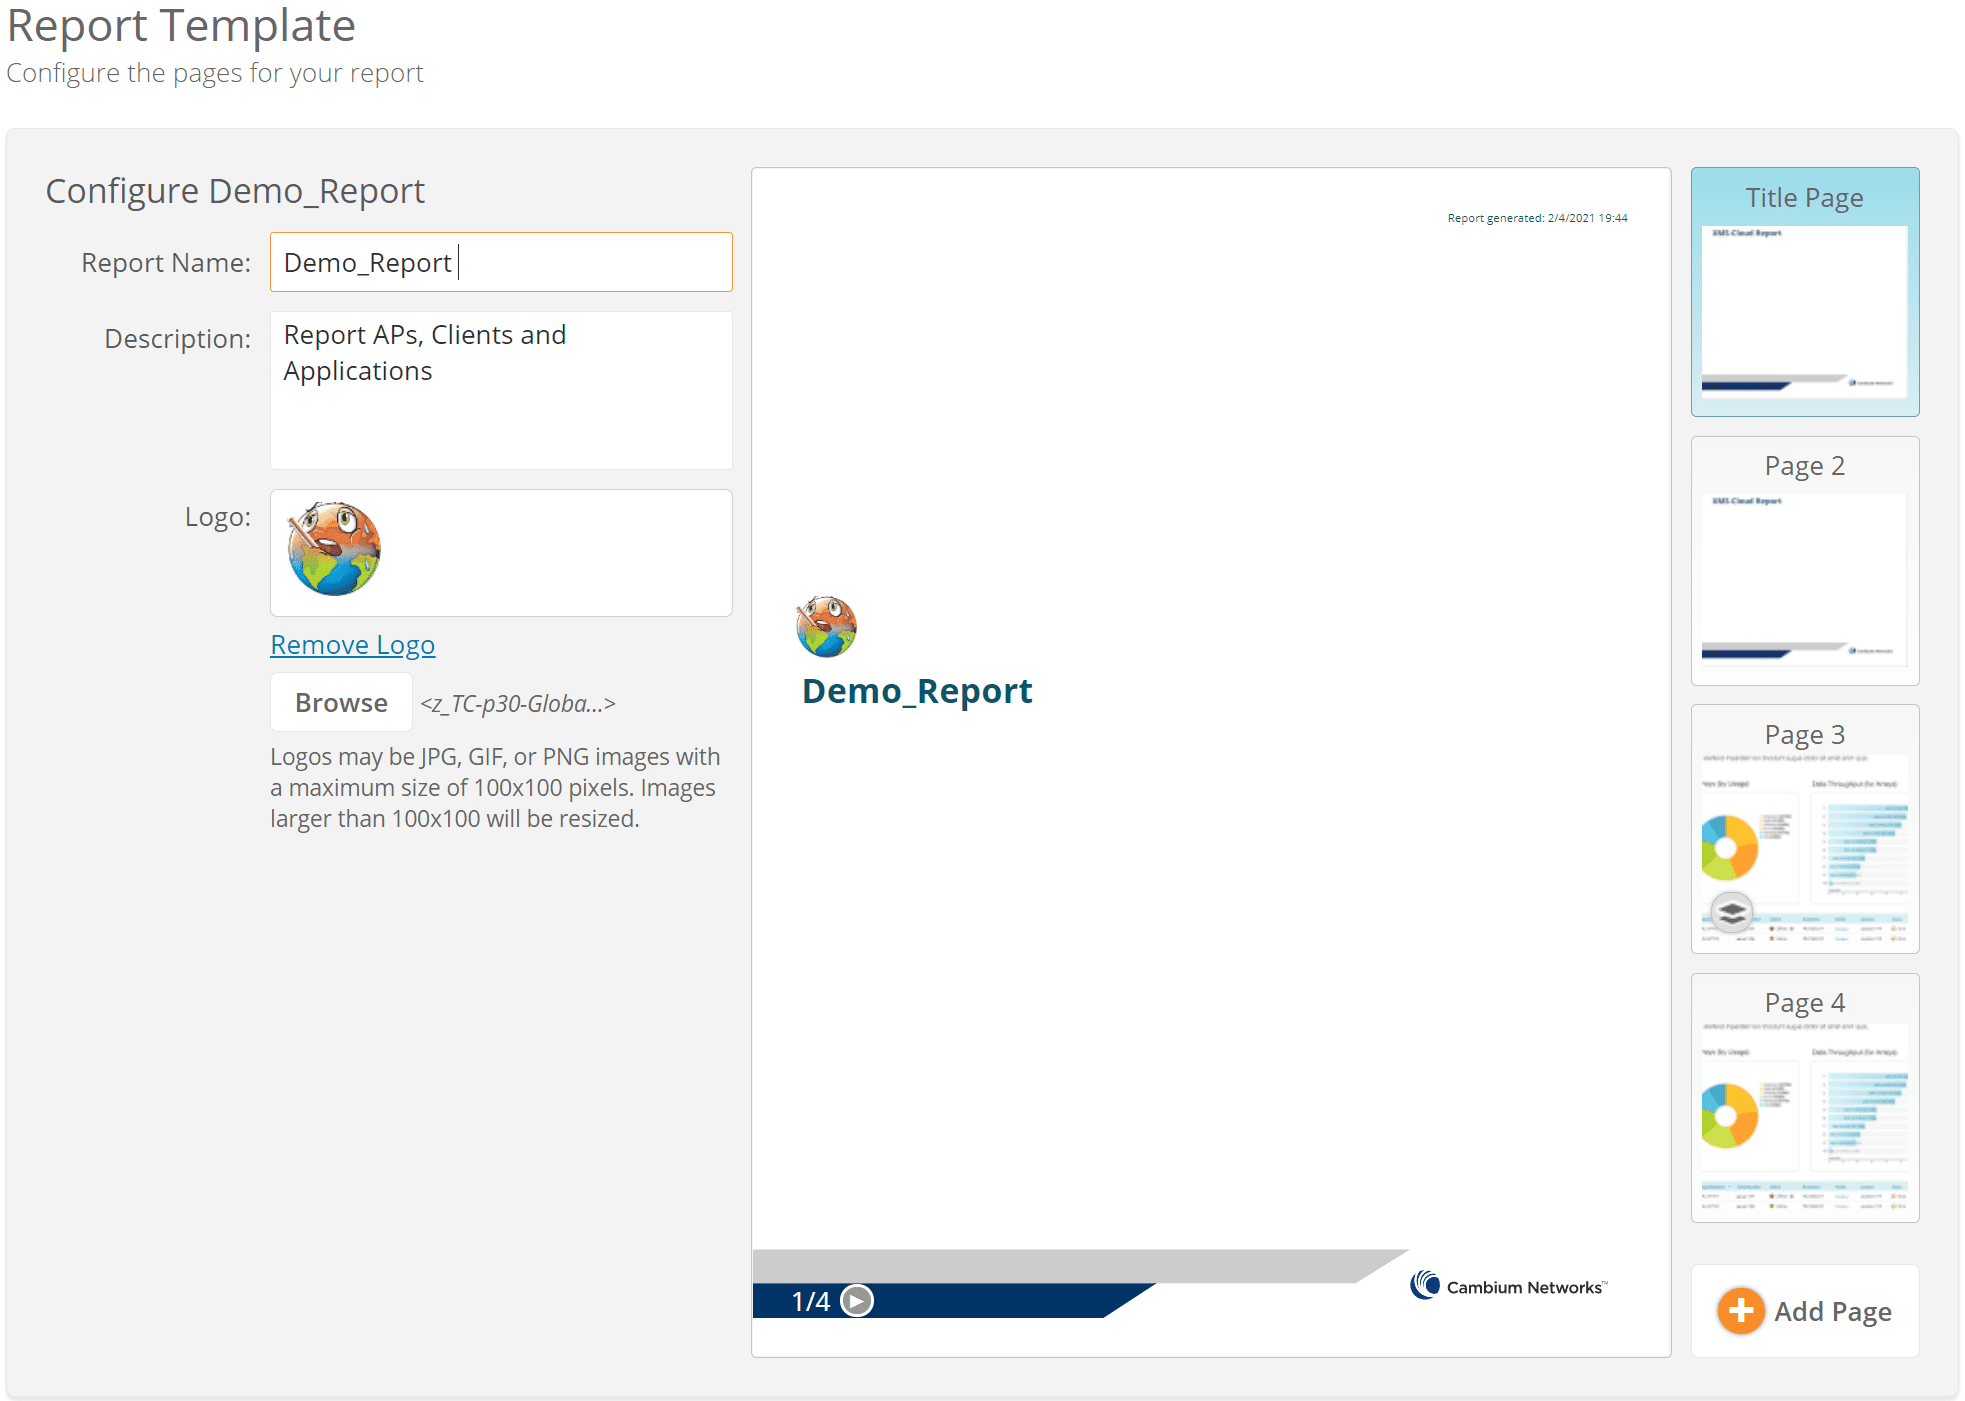
Step Four
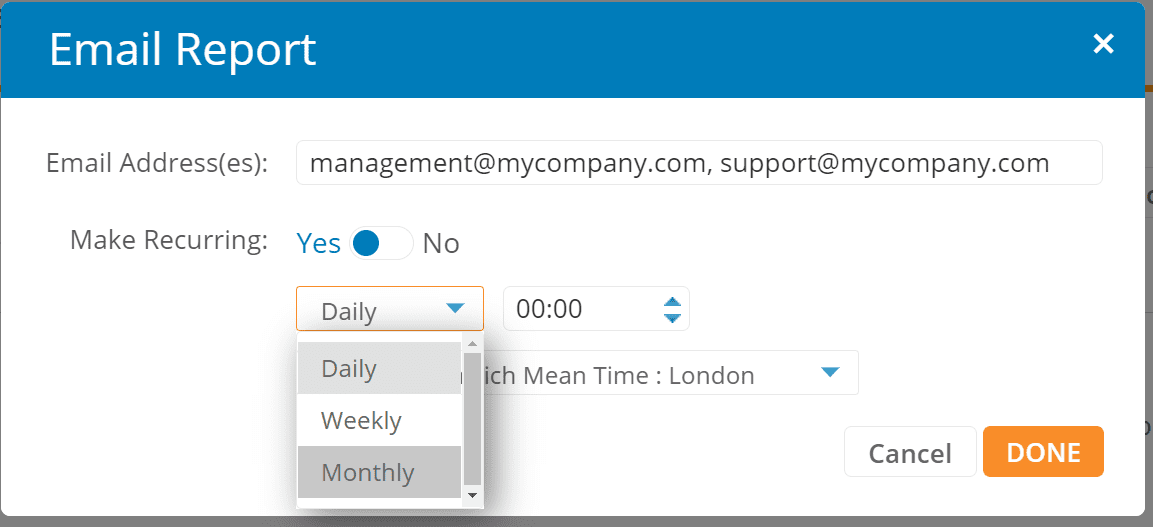
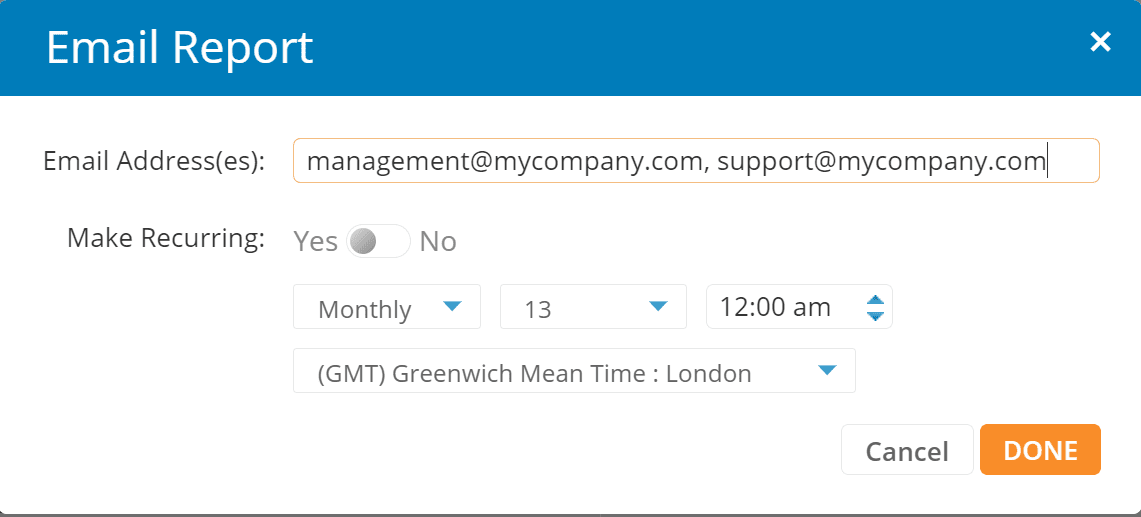
Print and Schedule Email Reports
Select the Print button
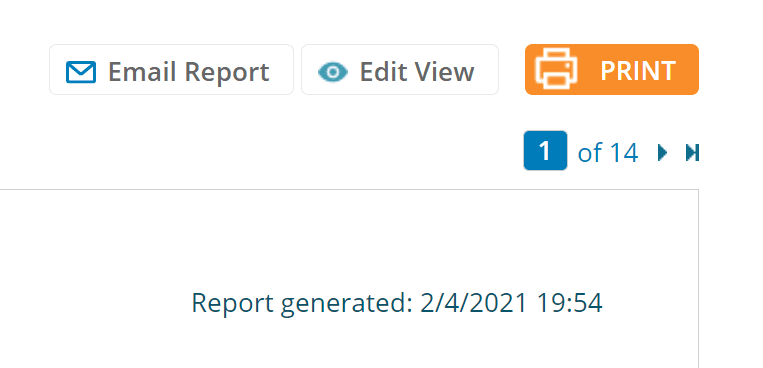
Select the Email Report to create a Scheduled Report.
CONCLUSION
We hope these steps have helped you to understand how to create a dashboard, troubleshoot a client and also how to set up a report.
If you’re interested in any of the products or services mentioned above, please get in contact:
+44 (0)1488 647 647