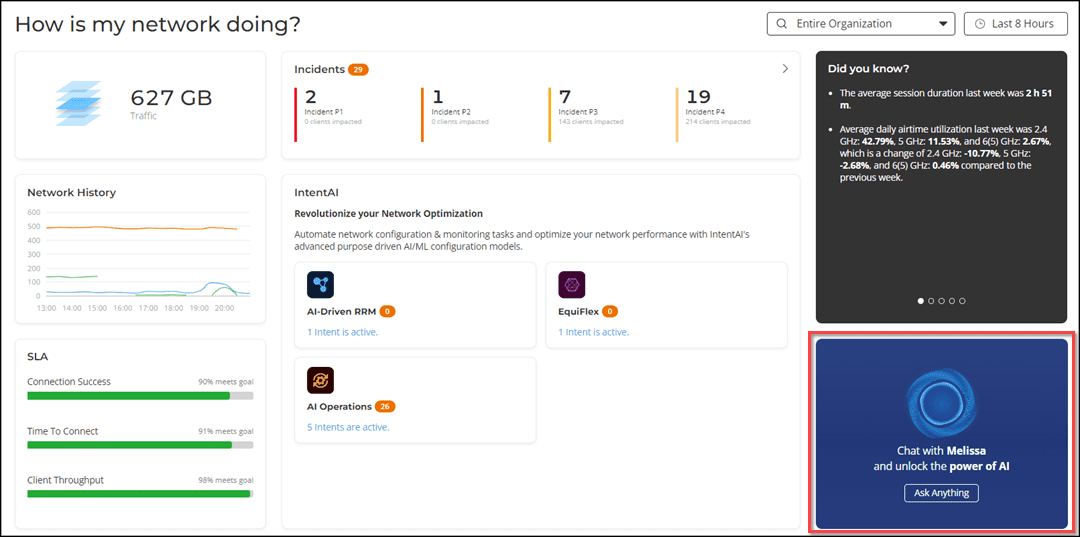
RUCKUS AI provides service assurance for business intelligence to maximise the potential from your enterprise network.
Using AI and Machine Learning, this cloud service simplifies tasks by ranking incidents by their severity without manual input by looking at the root causes and recommending steps to rectify the problems. With RUCKUS AI, it is much easier for users to manage their KPIs for better business decisions and outcomes.
RUCKUS AI supports SmartZone and RUCKUS One by providing cloud-based, AI-driven network intelligence, automation, and service assurance, analysing data for various RUCKUS products to offer insights, predict issues, faster troubleshooting, and simplifying complex, multi-access networks for better performance and efficient management.
Why Choose Ruckus Network AI?
BENEFITS OF AI
Outstanding network performance
Leveraging AI in RUCKUS solutions delivers excellent performance continuously 24/7. Reducing interference and boosting capacity, RUCKUS AI ensures top performance without additional admin involvement and with tools such as digital twins, testing can be done safely for any changes before rollout ensuring reliability and efficiency.
Higher resiliency
Cloud computing gives RUCKUS AI the power to tackle complex challenges fast. It analyses massive amounts of network data and applies insights almost instantly to improve performance. On large networks, these tasks could take IT teams hours, but with AI it is done continuously – reducing downtime and impact, freeing up IT teams for other responsibilities this allows for a stronger, more resilient network.
Reduced operational expenses (OpEx)
Contemporary networks deliver more services than ever, but that also means more complexity—and higher costs for skilled staff and ongoing training. Due to the complexities, despite being the experts, troubleshooting outages is harder than before. AI eliminates that stress and time necessary. Built into RUCKUS solutions, it eases the burden on IT teams and reduces operational cost.
RUCKUS AI
INFOGRAPHIC
A day in the life of a network administrator before and after using RUCKUS AI – click here to download
RUCKUS AI
HEALTH MONITORING
Overview of the health monitoring RUCKUS AI
RUCKUS AI
INFOGRAPHIC
A day in the life of a network administrator before and after using RUCKUS AI – click here to download
RUCKUS AI
HEALTH MONITORING
Overview of the health monitoring RUCKUS AI provides
RUCKUS AI
INFOGRAPHIC
A day in the life of a network administrator before and after using RUCKUS AI – click here to download
RUCKUS AI
HEALTH MONITORING
Overview of the health monitoring RUCKUS AI provides


