RUCKUS Analytics
RUCKUS Analytics
RUCKUS Analytics from CommScope is a cloud service that delivers robust reporting, informative dashboards and analytics powered by machine learning and artificial intelligence (AI) for your Ruckus network.
“Enterprise network operators today have an unprecedented amount of network health and performance data. But harnessing that data for maximum benefit is an immense challenge and requires a modern cloud-supported, machine learning-powered analytics platform.” IDC report from CommScope RUCKUS
What RUCKUS Analytics does and its functions
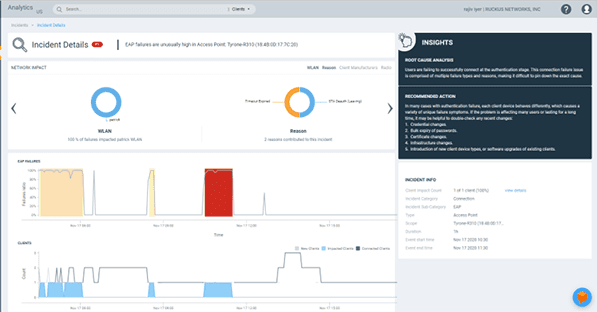
Incident Analytics (ML/AI-powered) – automatically detects and prioritises incidents
RUCKUS Analytics automatically establishes and detects any issues on a wired and wireless network without any IT input, it serves as a powerful network assurance. It uses machine learning to automatically identify service incidents that could be related to either connectivity, performance, or infrastructure – whatever the issue may be, RUCKUS Analytics picks up the errors on the system that affect user experiences. It then uses AI to classify the issues in severity and urgency with specific recommendations on how to address any issues.
What Incident Analytics Does:
- RUCKUS Analytics is constantly analysing network traffic for anomalies in spatial and temporal dimensions
- Incidents are automatically created when there is an anomaly detected
- Incidents are ranked from P1 (most severe) to P4 (least severe) based on scope, severity, and impact
- Automatic notification and integration with helpdesk ticketing solutions like ServiceNow is available
Client Troubleshooting – powerful detailed client troubleshooting tool
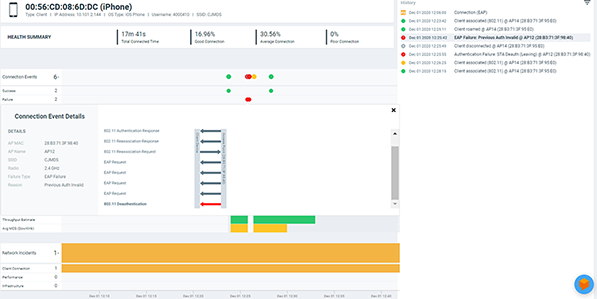
Advanced client troubleshooting features on RUCKUS Analytics, provides a simple way to search for clients that have any network service issues. Once identified it then provides full visibility on the type of connectivity that the client has – it classifies the network as either successful, slow, or failed connections. RUCKUS Analytics also provides quality metrics and information relating to specific failed connections and incidents.
What Client Troubleshooting Does:
- Client Troubleshooting page captures and replays failures for a specific client
- Automatic network protocol decodes, are available for troubleshooting
- Specific client, OS Type, AP, radio, SSID, and failure reasons are automatically displayed here
Health dashboard – immediate view of the health and performance
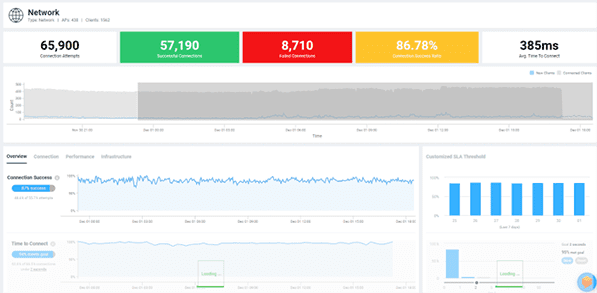
Full visibility into the core metrics of the entire network that categorises:
- Network performance
- Connection time
- Connection success
- Client throughput
- AP uptime and more
RUCKUS Analytics allows users to set the desired performance level for each metric by displaying the percentage of devices where the network meets that service level.
What Network Health Monitoring Does:
- Visualise overall health dashboard at the global level or filter by Domain, Zone, AP group
- Set custom network SLA and build charts to monitor performance
- Multi-metric Health SLAs for connection, performance and infrastructure KPIs
- Built-in visualisations for connection failures and long connection time
- Replay network state and diagnose past issues
Reports – carefully curated reports
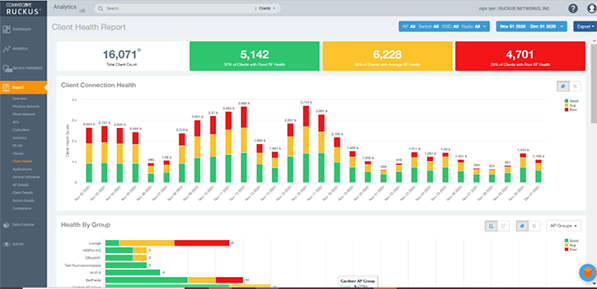
RUCKUS Analytics’ main dashboard gives an overall overview and summary of how the network operates, allowing users to click through from the top level to the most granular level of detail. Data Explorer tool allows users to custom their dashboards and tailor their needs and use the data to measure network performance, traffic patterns, application usage and more.
What Build-in Curated Reports Does:
- Wired and wireless network report
- 15+ reports with filters for AP, RF band, date and network scope
- Export in .csv and .pdf format available
- 12 months of network data available as reports
Service Validation – Turn APs into virtual test end clients
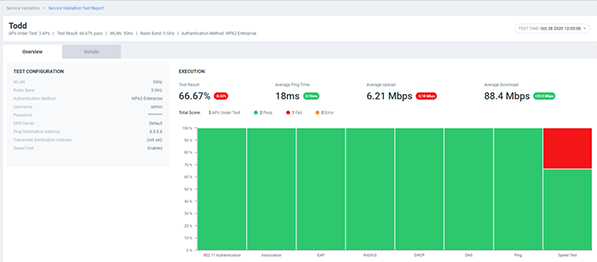
To fully take advantage of RUCKUS Analytics it works best with a RUCKUS network allowing it to self-validate without the need for overlay sensors. This helps the network function proactively without any potential service disruptions for users. With service validation, clients can address any issues before any network users experience any service problems.
What Service Validation Does:
- Conveniently orchestrate network tests from cloud
- No extra hardware sensor or test equipment needed
- Test WLAN, LAN and WAN connectivity
- Test EAP, RADIUS, DHCP, DNS, Ping, Traceroute, Speed Test (upload/download)
Melissa – Virtual Network Assistant
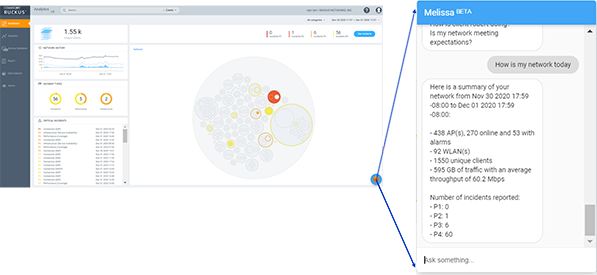
RUCKUS Analytics comes with an AI-powered virtual help assistant called Melissa, which answers any questions that an IT department might have regarding the network health, the most popular applications used, or the busiest SSID on the network today or last week. Melissa answers within seconds.
What Melissa Does:
- Melissa—conversational-AI-driven network assistant
- Understands intent and context
- Advanced natural language models
- Users can efficiently query, retrieve information and perform tasks
How RUCKUS Analytics Serves Your Business
- Accelerates network and client troubleshooting
RUCKUS Analytics saves time on troubleshooting for IT teams by resolving issues faster, eliminating site visits and enabling better planning through trending analysis and network planning.
- Provides comprehensive visibility into network operations
RUCKUS Analytics provides IT teams insight into the entire network, giving them the ability to prioritise and streamline workflows to a granular level by identifying important network issues.
- Helps IT teams improve the user experience – with a cloud-based service
Provides IT teams with the right tools. RUCKUS Analytics automatically automates tasks associated with routine service assurance, saving time and costs.
- Reduce IT operations OPEX
Cloud-based service provides virtually unlimited capacity for storing data on network operations and automatically updates, allowing technicians to focus on other duties.
Free RUCKUS Analytics Trial – Get a free 90 days trial with CommScope RUCKUS
For more information, give us a call on: +44 (0) 1488 647 647
Alternatively, email us: ruckus@purdi.com
