14 Mar 2023 The power to see inside of your network with RUCKUS Analytics
RUCKUS Analytics is about giving you the power to see the inside of your network. Using other platforms might give you restrictions with certain information and data being retained, or difficult to source. RUCKUS Analytics takes this one step further by removing these restrictions and giving you an insight into your network operations, allowing you to troubleshoot all remote sites whilst reducing unplanned opex.
RUCKUS Analytics can help you save 30% plus on your CAPEX by providing simple, intelligent analytical information. It allows you to save costs on troubleshooting, it provides faster resolution of issues, it eliminates costly and timely site visits but most importantly it provides you the capability for better planning through trending analysis.
As a AI/ML powered proactive network intelligence platform and service assurance solution, RUCKUS Analytics offers Cloud SaaS (Software as a Service) with an annual subscription that is available for both RUCKUS Cloud Wi-Fi and on-premise SmartZone* deployments.
*v5.1.2 and above
Service Assurance and Network Intelligence
RUCKUS Analytics has the capability to automatically detect and prioritise incidents. The platform is powerful enough to detect detailed client troubleshooting with an immediate view of the health and performance of the network provided through a health dashboard. It also provides comprehensive data visualisation tools with carefully curated reports.
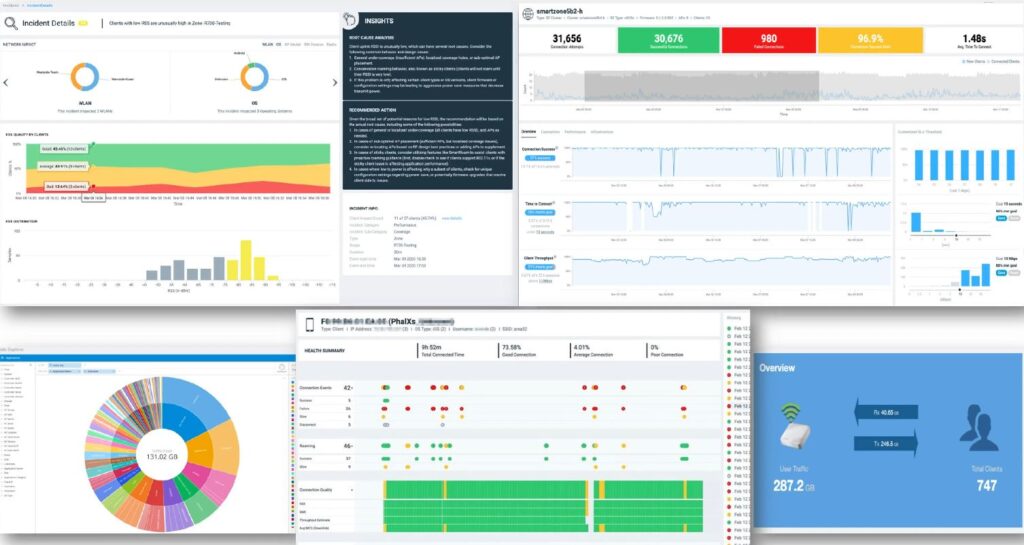
- Incident details highlighting route cause analysis and recommended actions.
- RSS quality as a client percentage and a number that had good, average, or bad RSS.
- What the incident is and the number of times it occurred, the zone it happened in, the scope and the duration of how long the incident lasted for.
- Through SmartZone it can also provide you a view of your connection success, whether your SLA has been met or failed, the connections you have had as well as the connection success ratio.
- You can also delve further into the data by creating your own data explorer and comparing metrics to see how these metrics compare.
- The health summary provides information about different connection events, roaming events, connection quality and more.
- You can see the overall user traffic to and from clients which can be tailored to specific date ranges if required, providing you an overall trend of how your networks are being utilised over a period of time.
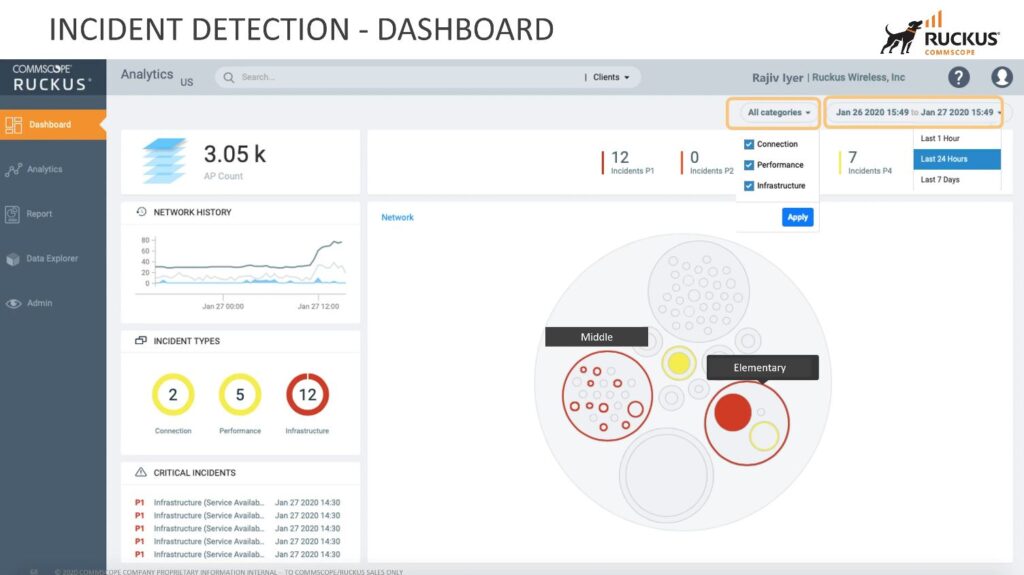
Incident detection dashboard
The incident detection dashboard gives you the information you need to understand any problems within your network and how many critical incidents have been highlighted. Using the dashboard, you can summarise the data by category which highlights connections, performance, and the infrastructure. You can also tailor this using a date range to pinpoint the exact information you require.
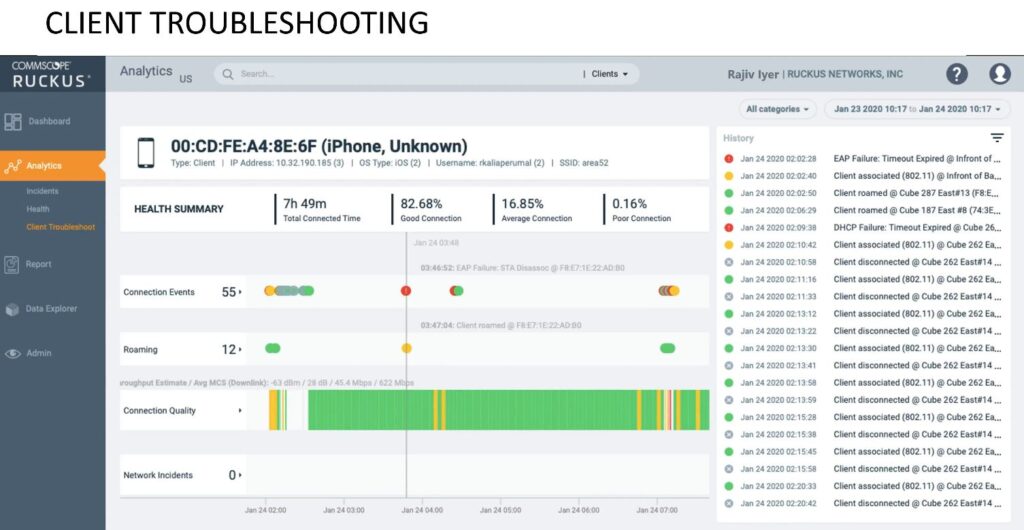
Client Troubleshooting
Client troubleshooting allows you to see client events by simply adding the MAC address of the client device. It provides you a history of troubleshooting failures for you to investigate further. Again, this can be tailored using a date range.
Network Health
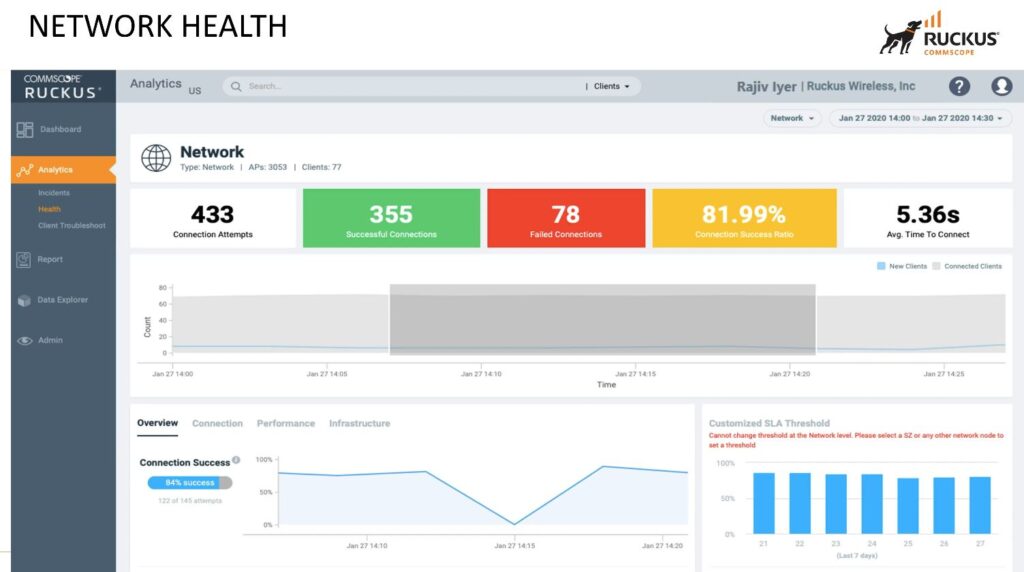
Using the network health dashboard, you can see the overall health of your network but also stage some what-if scenarios by adjusting the SLA for key KPIs. The dashboard provides an overview of connection success, with the ability to delve deeper into the connection, performance, and infrastructure analytics.
To find out what else RUCKUS Analytics can provide you, watch the latest of our Technical Family Videos presented by Alex Claro, Director of Technical at Purdicom.
Contact us
Our dedicated RUCKUS team are available today for you to get in touch. Simply send us an email at ruckus@purdi.com or call us on 03331 212 100 and we’ll be more than happy to help.
